Showing posts with label Statistics. Show all posts

Wednesday, December 13, 2023

Walnut Creek: Perception is Reality

June, 2022: smash-and-grab at Macy's, WC
Your humble blogger sometimes visits Walnut Creek and has found it to be a pleasant suburban community with both middle-class and upscale stores and restaurants. Its median household income of $130,000 is on par with the rest of the Bay Area and is well above the national average of $75,000.

Crime has recently made "sleepy" Walnut Creek's residents unsettled.
In recent months, Walnut Creek has witnessed flash mob commercial burglaries, likely perpetrated by crews that rove the Bay Area, according to law enforcement. In October, a group of would-be burglars smashed a stolen Land Rover into the Louis Vuitton store at Broadway Plaza, fleeing down Highway 24 when officers arrived. Weeks later, police arrested members of an alleged theft ring at a Lululemon boutique.

Fears intensified on Dec. 5, when three masked perpetrators confronted two victims — one of them an off-duty police officer — in the 1500 block of Bonanza Street. Brandishing a handgun, the assailants stole a wallet from one victim, then pistol-whipped and snatched a bag from the other victim before speeding off in a white Lexus.
Walnut Creek officials say that statistically crime has gone down:
Records from the Walnut Creek Police Department corroborate the downward trend. This year, the city had logged 39 robberies as of Dec. 11, compared with 47 for the whole year in 2022. Burglaries also appear to be declining: In 2022, police documented 304 reports. This year, residents and businesses suffered 206 burglaries through the end of October.

“It seems worse than it is,” [Mayor Loella] Haskew continued, suggesting that the “big exciting robberies” this fall drew undue attention, because they contrasted with Walnut Creek’s reputation as a sleepy, upscale bedroom community.
As we've found with school shootings, one or two well-publicized incidents overwhelm statistical analysis that argues conditions are improving. Perception is reality.

Wednesday, July 20, 2022

Terms of the Conversation

Ann Hsu (Chron photo)
Ann Hsu, who was appointed to replace one of the three San Francisco school board members recalled in February, is herself being asked to resign for saying [bold added]
one of the biggest challenges in educating Black and brown students was their “unstable family environments” and “lack of parental encouragement to focus on learning.”
She is accused of making "racist" statements, which fits the definition of racism if she is generalizing individual attributes ("unstable family environments") to every member of a racial group. IMHO, this is no different from saying that blacks are disproportionately poorer than whites, therefore all whites discriminate against all blacks or therefore society should make reparations to all blacks.

Your humble blogger much prefers that society judge, reward, and if necessary punish people based on their individual circumstances.

(Chart from U.S. Census)
However, if the rules of conversation about race mean that we have to look at group properties, then Ann Hsu has plenty of evidence to support her statement. For example the 2020 U.S. Census showed that the overwhelming majority of white (76%) and Asian (87%) children lived in two-parent households, which are only a minority of black households (38%).

The National Center for Education Statistics, a government agency, produced similar numbers in 2016:
In 2016, the percentage of children living with married parents was highest for Asian children (84 percent), followed by White children (73 percent); children of Two of more races, Pacific Islander children, and Hispanic children (57 percent each); and American Indian/Alaska Native children (45 percent). The percentage was lowest for Black children (33 percent).
Because of the high correlation between family stability and educational achievement, it's not a great leap to claim that one is a major cause of the other. (If other factors are key, then propose, quantify, and test them.) Of course, coming from a two-parent household does not guarantee high achievement, while many kids who are raised by a single parent are enormously successful; these statistics mean little when it comes to predicting the outcome for a specific child.

But if people insist on talking about group outcomes--and by implication doling out benefits purely due to membership in a group--then group characteristics, including behavioral tendencies, are fair game.

Ann Hsu should not retract her statement, unless all parties agree to stop making generalizations about race.

Thursday, January 06, 2022

The Other Dismal Science

(Image from the balance)
I never gave a thought to actuarial science until I went to business school. One of the smartest guys in the class had been an actuary, which I came to understand was too tough a career choice if I had to be as smart as he was and pass difficult, technical exams. (BTW, he's now CFO of a well-known company.)

Digression: so I became a CPA, which meant sitting for two days of exams and working for two years in the audit department of a CPA firm. The latter path was easier, and besides, I've never had to pay anybody to do my taxes.

Apparently, becoming an actuary is even tougher these days: [bold added]
Among people taking at least one exam from the Society of Actuaries—the field’s biggest U.S. credentialing body—15% eventually pass the multiple tests required to become an Associate, one of two designations allowing them to practice. Just 10% pass those and additional tests to become a Fellow, the group’s higher designation, which affords bigger responsibilities and salaries.

It’s such an arduous process that the number of test-takers has been declining in recent years, and the society is making changes to keep candidates from dropping out of the gantlet. It is also adding new “predictive analytics” tests to adjust to the massive amounts of data insurers now have...

There is no limit to how many times a candidate can take the tests. It took one man 50 years to become a Fellow, says Stuart Klugman, an official at the society. The society says a candidate typically takes seven to 10 years to become a Fellow. They must pass 10 exams plus other coursework and requirements.
Every profession is being inundated with oceans of data, and being familiar with data science has become essential to being an actuary. Knowing how to filter, analyze, and model the data is crucial to success. (We noted the importance of predictive analytics three years ago.)

If one is not thorough, knowledgeable about statistics, and honest, one can easily promulgate misinformation by biasing the data sets, selecting or not selecting variables to be analyzed, finding causation in correlation, and not "showing the work" so that results can be replicated.

Why must an actuary be honest? Because as the analyses become more complex, and as the demand for risk assessment (not only for insurance purposes) explodes, there are fewer people who are available to check the work; actuaries must be trusted not to force through results that please the powers that be.

I was glad that I didn't try to become an actuary.

Just for fun: the article presents a sample question involving rudimentary statistics and algebra. Without using a calculator, I could still solve it. (My high school self could have figured it out much more speedily but would also have snickered throughout at the phrase "blue balls.")
“An urn contains 10 balls: 4 red and 6 blue. A second urn contains 16 red balls and an unknown number of blue balls. A single ball is drawn from each urn. The probability that both balls are the same color is 0.44. Calculate the number of blue balls in the second urn.”


Saturday, August 14, 2021

It's Only A Number

"One million people" is a significant threshold for a city. In the U.S. one million is enough to get on the leaderboard; San Jose is #10 at 1,036,000.

The 2020 census confirmed that Honolulu has reached the big time:
the results of last year’s census — the first to allow households to respond to the decennial survey online — set Honolulu’s population at 1,016,508, up 6.6% from an influx of 63,301 residents since 2010, according to data released Thursday.

The state as a whole experienced a 7% population increase from the last census, with 1,455,271 people counted, including 94,970 new residents over the 10-year period.
When Hawaii became a state in 1959, the total population was 633,000. It finally crossed the one-million mark in the 1990 census.

30 years later the City of Honolulu has hit the magic number. After the residents have come to understand all the costs that entail being a big city, that achievement is not necessarily held in such high esteem.

Monday, July 19, 2021

NBA Finals: Unexpected and Interesting

Giannis Antentokounmpo and Chris Paul (nba.com)
The NBA playoffs have been a war of attrition, with teams trying to survive with their best players being knocked out of the playoffs. If every team was at full strength, we would probably be watching a Lakers-Nets final, but without Anthony Davis, Kyrie Irving, or James Harden both favorites lost in the early rounds. Nevertheless I'm watching.

Perennial All-Star and Hall of Fame shoo-in Chris Paul had never played in a conference final, much less in a championship.

He made the Phoenix Suns a sentimental favorite; at 36, the point guard is running out of chances to get a ring. However, I also feel sympathy for two-time MVP Giannis Antentokounmpo, a young, likeable, talented giant who has trouble making free throws (like a pro golfer who can drive the ball 350 yards but can't make a 5-foot putt).

So I like both the Phoenix Suns, who have never won a championship, and the Milwaukee Bucks, whose last title was 50 years ago. Both teams are flawed but seem evenly matched, and the last two games were decided in the final minute.

Now, a small complaint about modern sports commentary. Analysts bombard the audience with statistics, some interesting but many times not. If they're going to occupy our precious attention span, please don't waste it on triteness masquerading as insight.

Going into Saturday's game, reporters kept repeating the fact that in a series tied at 2-2
the team that wins Game 5 has gone on to win the series 72% of the time (21-8).
Note: Milwaukee won and holds a 3-2 lead in the series.

When kids are introduced to algebra and elementary statistics, they are asked to construct a simple coin-flip table and calculate the probability of getting heads twice in a row. There are four possible outcomes to two coin flips, so there's a one-in-four chance (25%) of getting heads twice.

But what's the probability of getting at least one head in the next two flips? Obviously, the answer is 3 out of 4, or 75%.

If the NBA finals has two evenly matched teams (almost by definition, if the games are split 2-2), then a simple statistical model in the absence of data would predict that the team that wins Game 5 goes on to win the championship 75% of the time. The actual result, 72%, is well within the range of expected outcomes in a population of 29 data points.

The surprise would be if the historical record produced a number higher than 80% or lower than 70%. Now that would be interesting.

[Update - 7/20/21: The Milwaukee Bucks won Game 6, making them NBA champions. Their victory adjusts the historical record slightly: teams that win Game 5 become champions 73.3% (22-8) of the time.]

Wednesday, December 30, 2020

The High and the Low

Graph: LA Times
To stop the spread of the coronavirus California has been dictating lockdowns and business closures for the past nine months.

It all seems so futile, as the recent growth of infections has made the Golden State "the nation’s coronavirus epicenter":
With hospitals across California at capacity and COVID-19 cases skyrocketing, the state has become the epicenter of the nation’s latest coronavirus surge despite aggressive measures to restrict movement and save hospital space.

As of Wednesday, California reported 99.3 coronavirus cases per 100,000 people over the past seven days, far exceeding all other states, according to data compiled by the New York Times.
To make an increasingly restive population hunker down, California has resorted to fear, blaring that there is zero ICU capacity throughout the State. But a closer look tells a more nuanced story. [bold added]
The complicated answer is that the state uses a very complex algorithm to come up with that number. It’s based on a whole bunch of different factors that they put into an equation to come up with that percentage.

But in the most simple lay terms, every hospital has a certain number of intensive care beds that are licensed by the state. The state licenses your intensive care beds and you have to have the staff and the equipment for that bed to be deemed appropriate for intensive care.

But each of these hospitals also has systems in place, and they have these in place all the time, for a busy flu season, for a busy summer season if they get a lot of car accidents. So, it’s beds that can be used for so-called surge capacity, where they put patients if they do run out of room with these licensed ICU beds.

What this 0% means is they have essentially used up all of their licensed beds, and they are now into this surge capacity. It varies a lot from hospital to hospital. In Southern California, you have some hospitals that, I think, they are at 200%. So they are doubling up patients in rooms, they have patients in the emergency room that are getting intensive level of care. And we're seeing this across the region in Southern California and in the San Joaquin Valley.

But some of those hospitals may have a few beds. It’s not necessarily saying that every hospital is at 0%. It just means that, for the whole region, there are enough of those hospitals at overcapacity that it takes away from the total number for the region, and that’s the same for the state.

Right now, the California Department of Public Health keeps telling us that we are at 0% availability for ICU beds in the entire state. We know that’s not true because we know the Bay Area, for example, has a fair amount of ICU beds still available. We’re worried about it; we’re worried about the strain. But we still definitely have ICU beds available. What that means is just that so many hospitals in these hard-hit parts of the state are so far overcapacity that it’s eating into the statewide technical availability.
To sum up, "zero %" capacity means there are no more licensed ICU beds in the State overall. If an LA hospital converts one non-ICU bed to handle the surge, the State algorithm subtracts one available bed in San Francisco.

The headline is dishonest and meant to scare us into compliance. Unfortunately, this selective disclosure of information doesn't come as a shock, and it's no wonder trust in the government--no matter what one's political persuasion--is at an all-time low.

Sunday, September 13, 2020

Another Cheerful Time Cover

Last week your humble blogger pointed out how easy it was to detect the bias of a publication.

Because Time wanted to minimize the damage of Black Lives Matter protests, Time used statistics instead of a count: 570 violent riots in 220 cities and towns in three months became "93% of Black Lives Matter Protests Have Been Peaceful, New Report Finds". Reporting it in this manner gave the impression that the movement is mostly peaceful.

On the other hand a statistical headline--for example, "Americans have a less than 0.1% chance of dying from the coronavirus in 2020"-- doesn't horrify the reader. Instead, the emphasis is on "the absolute number of deaths"-- 189,000 in the United States at the time of the post.

U.S. infections and deaths as of this writing
As predicted, this week's cover, in funereal black, anticipates U.S. virus deaths reaching 200,000. As of this writing the toll is 193,000; it's almost as if Time can't wait to trumpet the milestone.

In our vast nation, where the annual number of deaths from heart disease and cancer are 655,000 and 606,520, respectively, 200,000 virus deaths are a sign of monumental failure, and Time knows who to blame:
Although America’s problems were widespread, they start at the top. A complete catalog of President Donald Trump’s failures to address the pandemic will be fodder for history books. There were weeks wasted early on stubbornly clinging to a fantastical belief that the virus would simply “disappear”; testing and contact tracing programs were inadequate; states were encouraged to reopen ahead of his own Administration’s guidelines; and statistics were repeatedly cherry-picked to make the U.S. situation look far better than it was, while undermining scientists who said otherwise. “I wanted to always play it down,” Trump told the journalist Bob Woodward on March 19 in a newly revealed conversation. “I still like playing it down, because I don’t want to create a panic.”
"Statistics repeatedly cherry-picked"--that's a good one by a publication that cherry-picks numbers every week to flog systemic racism or denigrate Donald Trump.

"The death of one man is a tragedy. The death of millions is a statistic." – Josef Stalin, reportedly.

Tuesday, July 03, 2018

Ivory Tower

(Image from Kiplinger.com)
Buying the right gift has always been a problem for your humble blogger; in some cases the gifts were received so unenthusiastically that I would have been better off giving cash, gift cards, or even a donation to charity in the recipient's name. In the dry language of economics
A gift will cause a misallocation of resources if the recipient would have preferred something else that would have been no more expensive for the donor to acquire.
So why do we continually "misallocate" (buy the wrong) gifts, even for those whom we know well? Researchers theorized that expressions of gratitude--smiles and hugs, for example--steer donors in the wrong direction.
Dr Yang and Dr Urminsky framed an experiment around St Valentine’s day. They picked three pairs of appropriate gifts: a dozen roses in full bloom versus two dozen rose buds that were about to blossom; a bouquet of freshly cut flowers versus a bonsai; and a heart-shaped basket of biscuits versus a similar basket of fruit...

[Donor] men went for the smiles and hugs more often than it would seem that [recipient] women would have wished. Specifically, 44% of them said that they would prefer to give roses in full bloom while only 32% of the women said they preferred that gift to the two dozen buds. Similarly, with the bouquet and the bonsai, 40% of the men preferred to give the bouquet but only 28% of the women preferred to receive it.
(Biscuits, i.e., cookies in American English, were chosen by both donors and recipients over flowers).

The researchers were puzzled why the women displayed more affection over the gift with a short-term life (i.e. floral bouquet), although they said they preferred the longer-lived one (the bonsai). Really? Didn't they ask any husbands about the cold reception for a practical, long-lasting gift like cookware or an electric shaver? Don't the researchers have any life experience?

Definition of an economist: an academic who knows the price of everything and the value of nothing.

Saturday, April 08, 2017

Not Fake Science, Yet

(Slide presentation here)
WSJ: Biomedical research has so many problems that most published research findings are false. Follow-up studies on various "breakthroughs" could only reproduce 10% to 50% of the original claimed results.

Problems include:
  • contaminated lab samples [for example, breast-cancer experiments performed on melanoma cells);
  • cherry-picking or massaging data;
  • too-small sample sizes;
  • design flaws (for example, attributing a difference in disease rates to a drug without accounting for the role of genetics);
  • "the professional pressure to get splashy results";
  • not enough money to do experiments without cutting corners.

    The answer, so universal that it's a cliché, is transparency:
    researchers should make all of their methods and data freely available. This would allow the more rapid correction of faulty work—and would also encourage researchers to be more careful in the first place. [Virginia professor Brian] Nosek has created a free online resource called the Open Science Framework that is designed to allow scientists to make their hypotheses, methods, computer code and data freely available. For its part, Johns Hopkins University is pioneering a program that verifies exciting results from lab studies before those findings get passed along to biopharma companies.
    Results of biomedical experiments should indeed be regarded with a great deal of skepticism, but let's put this in perspective: these are flaws of hard science conducted in laboratories, the problems have been recognized, and solutions are being offered.

    Contrast the above with the even less rigorous methods of climate scientists,
  • who cannot conduct double-blind experiments (contemporaneous worlds with and without carbon dioxide concentrations),
  • who are strongly incentivized to cherry-pick and massage data,
  • who don't release the raw data on which their conclusions are based, and
  • whose models consistently predict higher global temperatures than those that actually result.

    But then again, I'm no scientist.
  • Monday, March 02, 2015

    "Prediction is very difficult, especially if it's about the future"---Bohr

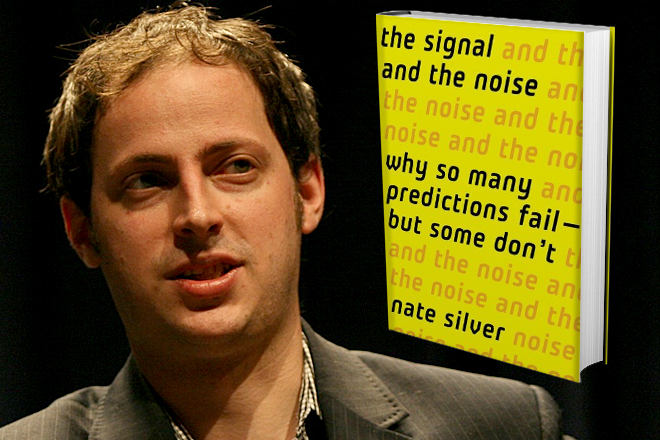
    (Photo from salon.com)
    Sports and political prognosticator par excellence Nate Silver, on why making sports predictions is much easier than making predictions in other areas, such as economics or politics:
    Sports has awesome data: "I mean data that’s accurate, precise and subjected to rigorous quality control." Also, it's extensive; in baseball's case the statistics go back over a hundred years.

    "When the recession hit in December 2007 — the worst economic collapse since the Great Depression — most economists didn’t believe we were in one at all."

    In sports "rules are explicit and...we know a lot about causality." Nate Silver contrasts sports with the real-world example of earthquake prediction, where the causes are not well-known. In trying to determine correlations "there are a billion possible relationships in geology’s historical data, [and] you’ll come up with a thousand million-to-one coincidences on the basis of chance alone."

    Sports offers fast feedback and clear marks of success. If sports tactics are working, results show up nearly instantaneously. In contrast one most wait four years to test Presidential election strategies.
    Big data is the management fad du jour because it has yielded impressive results in non-sports areas. But non-technicians often underestimate the work necessary to screen, organize, and analyze the information.

    Prediction: when big data doesn't produce miraculous insights--as it often won't because not everyone is as skilled as Nate Silver--expect disappointment.

    Monday, October 27, 2014

    Shades of Philadelphia

    After winning game 5, the San Francisco Giants are going back to Kansas City for games 6 and 7 (if needed) with a 3-2 lead in the World Series.

    The question on the talk shows this morning is: would you rather be the visiting Giants who need to win one, or the Royals, who need to win two on their home field? History, with a little math, provides the answer. In the National League Championship Series of 2010 the Giants were in the identical situation vis-à-vis the Phillies:
    Let’s say that the Phillies are 3-2 (winning 60% of the time) favorites to win each game they play against the Giants. Combining the probabilities, the Giants are 40% + (40% x 60%) = 64% likely to win one of the next two games....

    Even if one thinks that the Phillies are 2-1 favorites in these home games—in other words twice as good as the Giants—the same calculation [33% + (33% x 67%)= 55%] still shows the Giants more likely to prevail than not.
    The Giants ended up beating the Phillies, 3-2, in game 6 and went to the 2010 World Series, where they triumphed over the Texas Rangers.

    Current Las Vegas odds give the Giants a 42% probability of winning game 6, implying an overall greater-than-60% probability of being crowned champions.

    Mayor Lee should start planning the parade.

    Friday, September 19, 2014

    A Useful Application

    Another useful application of data analytics: Time, via IdealSeat, shows the ballpark sections that have the highest probability of receiving a foul ball.

    At AT&T Park the section is not behind home plate but near the right field foul pole. (When we sat near the visitor's dugout in August it seemed like the sections behind us got at least one ball per inning, but that observation is, of course, only anecdotal.)

    Sunday, March 16, 2014

    Poor, Deluded Moi

    I'm going to fill out the entry for Warren Buffett and Quicken Loans' $1 Billion NCAA bracket challenge. Yes, the odds are 1 in 9 quintillion against anyone winning, that is,
    If all 317 million people in the U.S. filled out a bracket at random, you could run the contest for 290 million years, and there’d still be a 99 percent chance that no one had ever won.
    I'll get some enjoyment out of playing---and fantasizing--just as I will for spending $5 on a Mega Millions lottery ticket now that the jackpot is $400 million.

    If someone does win the Bracket Challenge, I'll take it as proof that all is not randomness and that God does exist. Not logical, I know, but allow me to have my delusions.

    Thursday, December 13, 2012

    Sunday Math

    The use of data analysis in the world of baseball was popularized in Moneyball, first the book, then the movie. Now the geeks are taking over the front offices in professional football (link requires SI subscription).
    Now nearly every team in the NFL has an analytics group, though most are as forthcoming as the CIA regarding the work these employees perform. [snip]

    Among those teams riding the stats wave are the Ravens, who announced in August that they'd hired a former NBA statistical consultant with degrees from Yale and Carnegie Mellon to lead their new analytics department. They're just now catching up to opponents like the Patriots, and the 49ers, who in 2001 lured Stanford M.B.A. Paraag Marathe from his consulting job at Bain & Co. to lead their analytics department.
    It's nice to know that the San Francisco 49ers are second to none in the analytics arms race:
    "There's one team right now that is applying all of this better than everyone else, and that is San Francisco," says [Jaguars executive Tony] Khan. He points to one 49ers play in Week 10, against the Rams: San Francisco faced fourth-and-one at St. Louis's 21-yard line, down 10 in the fourth quarter. The Niners went for it, converted and scored a touchdown two plays later. The game ended in a 24-24 tie. "Most people disagreed with that," says Khan. "But I've seen the chart they use. And certainly guys like [pioneering football statistician] Brian Burke agreed with what they did."
    Although the article is about football, the writer throws some love at the baseball Giants:
    Throughout professional sports, forward-thinking teams are engaged in an arms race for new technology that can lend them any advantage. The most progressive organizations have quietly begun incorporating video technology into their analysis: Fieldf/x, which tracks players' movements on the baseball field, has been a secret weapon for the world champion San Francisco Giants; and 10 NBA teams use SportVU, which can identify opposing teams' plays based on movements. NFL teams are starting to use similar technology: This year the Falcons, Giants and Jaguars began using GPS tracking technology on their players during practices. (The league prohibits it during games.)
    Note: The local basketball team, the Golden State Warriors, uses video-capture technology from Sportvu (aka Stats LLC). Perhaps Titletown will be here sooner than we thought. © 2012 Stephen Yuen

    Monday, October 15, 2012

    Rarer Than Halley's Comet

    The Giants beat the Cardinals today, 7-1, to even the National League Championship Series at one game apiece. Ryan Vogelsong had the best outing for a Giants pitcher this postseason by handcuffing the Cards for seven innings before turning over the ball to the bullpen.

    An event that could have future repercussions was the first inning hard slide into second base by outfielder Matt Holliday, injuring (but x-rays showed not severely) Giants second baseman Marco Scutaro. Possibly inspired by the blow to their teammate, the Giants' bats erupted and had the game in hand, 5-1, by the fourth inning.

    To this humble observer the most remarkable event was a statistical rarity [bold added]:
    Vogelsong doubled in the sixth to become the first Giants pitcher to get a postseason extra-base hit since Jack Bentley homered in the 1924 World Series.
    After 1924 the New York Giants played in five World Series. Since moving to San Francisco, the Giants have played postseason baseball ten times, making it to the World Series on four occasions. Through those 88 years of playoffs, not one Giants pitcher had a double, triple, or home run until tonight.

    One of the reasons that we love baseball: it has an unrivaled library of statistics that can tell us that what we're looking at hasn't been seen or done for nearly a century (or, in the Cubs' case, for over a century). Perhaps we'll see more such moments in the weeks ahead.

    Sunday, April 29, 2012

    Everything is Proceeding as Asimov Has Foreseen

    "Big Data" is the plastics of the early 21st century. It's the next big thing. According to McKinsey [bold added],
    "We project a need for 1.5 million additional managers and analysts in the United States who can ask the right questions and consume the results of the analysis of Big Data effectively." What the industry needs is a new type of person: the data scientist. [snip]
    Hilary Mason, chief scientist for the URL shortening service bit.ly, says a data scientist must have three key skills. "They can take a data set and model it mathematically and understand the math required to build those models; they can actually do that, which means they have the engineering skills…and finally they are someone who can find insights and tell stories from their data. That means asking the right questions, and that is usually the hardest piece."
    Good at math, engineering, finding insights, and telling stories...if the data scientist is not the Ãœbermensch, then he or she is at least someone who needs to have high SAT scores all around.

    The late Isaac Asimov foresaw this future over a half-century ago.  His science fiction novel Foundation introduced the notion of psychohistory, in which future events could be predicted by applying statistical analysis to societal data on a vast scale. When Asimov wrote his novel in 1951, the computational technology to make psychohistory a reality seemed out of reach. That day is now here.

    If the Graduate were re-imagined today:

    Mr. McGuire: I just want to say two words to you. Just two words.
    Benjamin: Yes, sir.
    Mr. McGuire: Are you listening?
    Benjamin: Yes, I am.
    Mr. McGuire: Big Data.